Namespace policy
Configure protected networks, approved peers, ingress services, egress destinations and protocol controls.


THE ESBA APPLIANCE
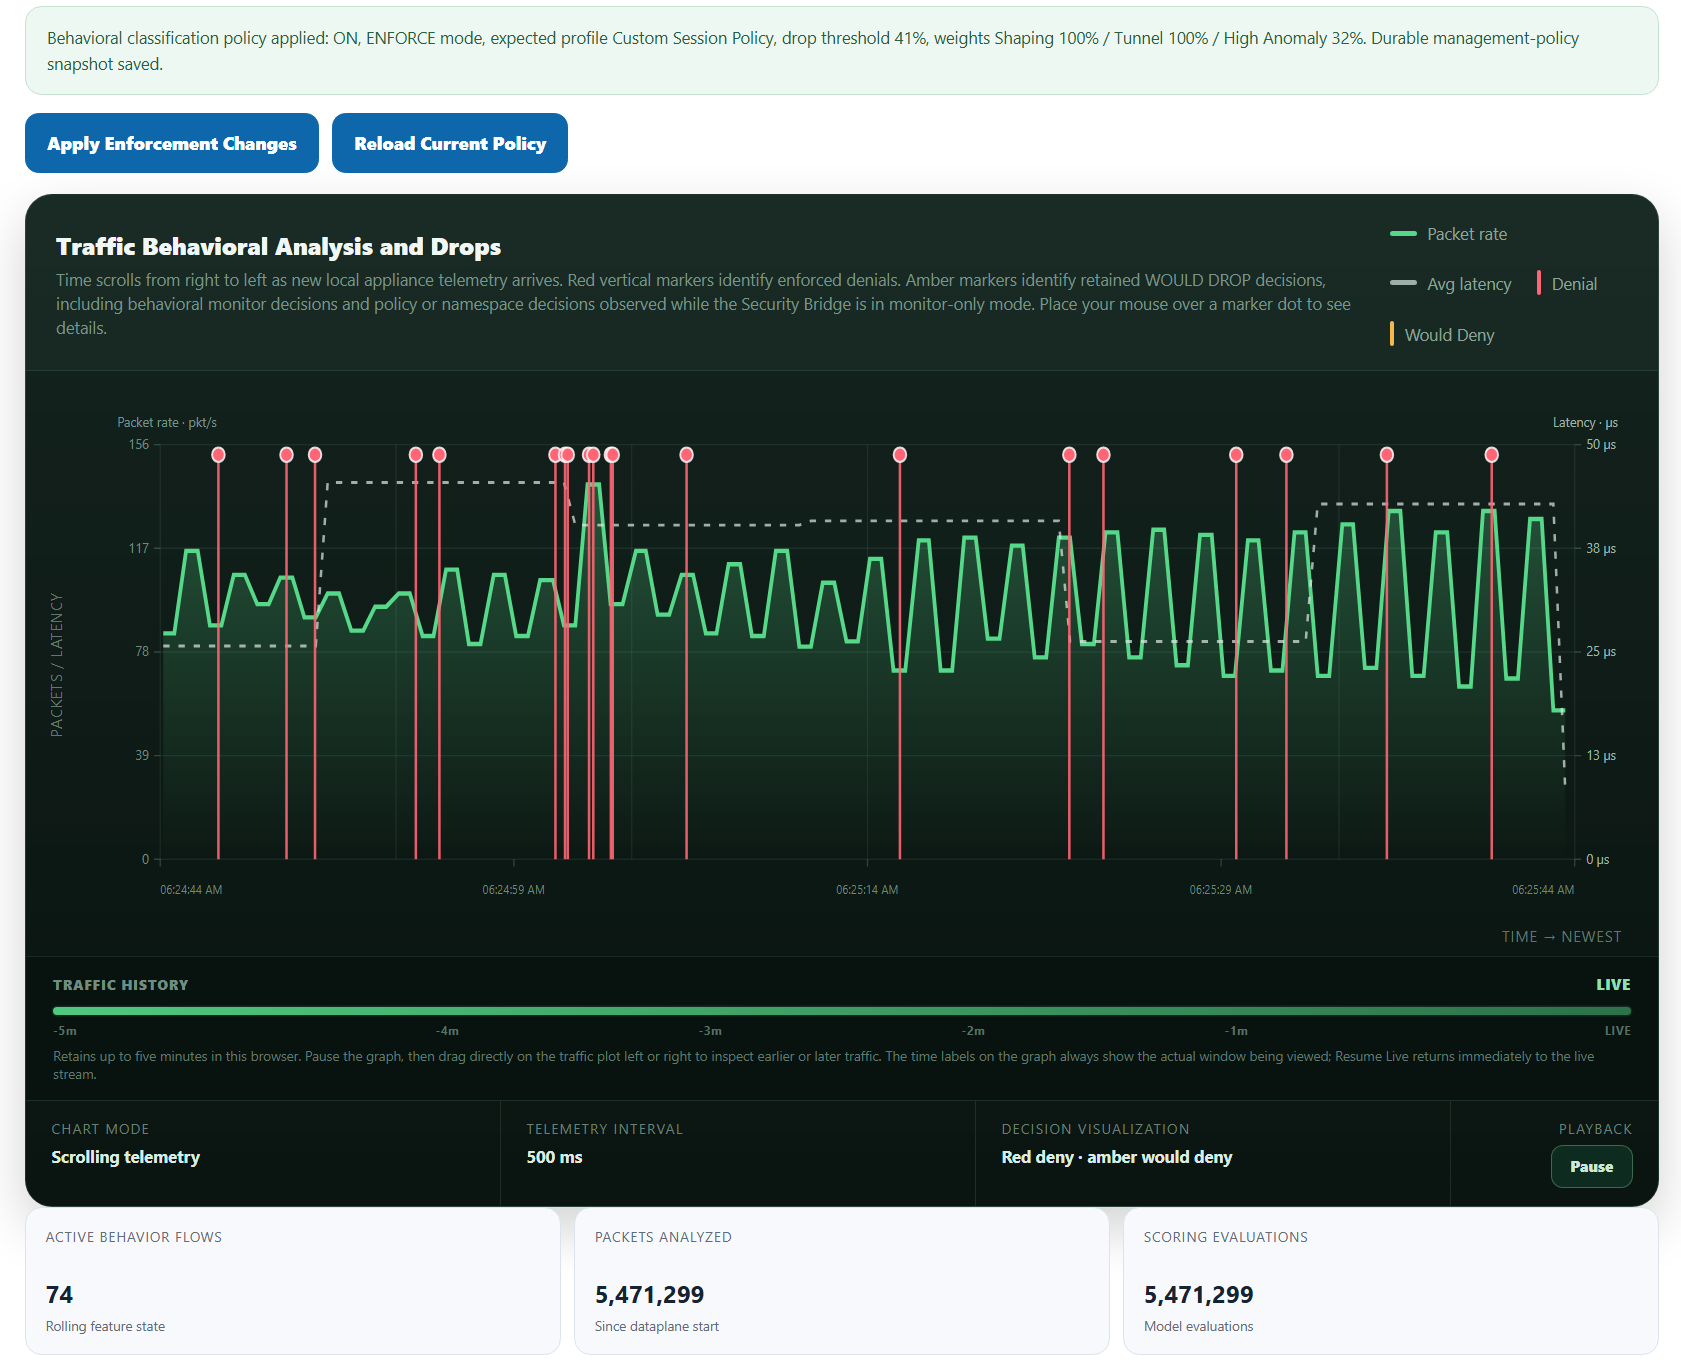
Configure namespace security, review actual enforcement data and monitor live behavioral telemetry from the appliance management interface.
ACTUAL APPLIANCE SCREENSHOT
This pilot interface plots packet rate, average latency and denial markers. Red markers indicate enforced denials, while amber markers indicate monitor-only would-deny decisions where applicable. This is a captured interface, not a live feed.
ENFORCEMENT LOGS / AUDITABILITY
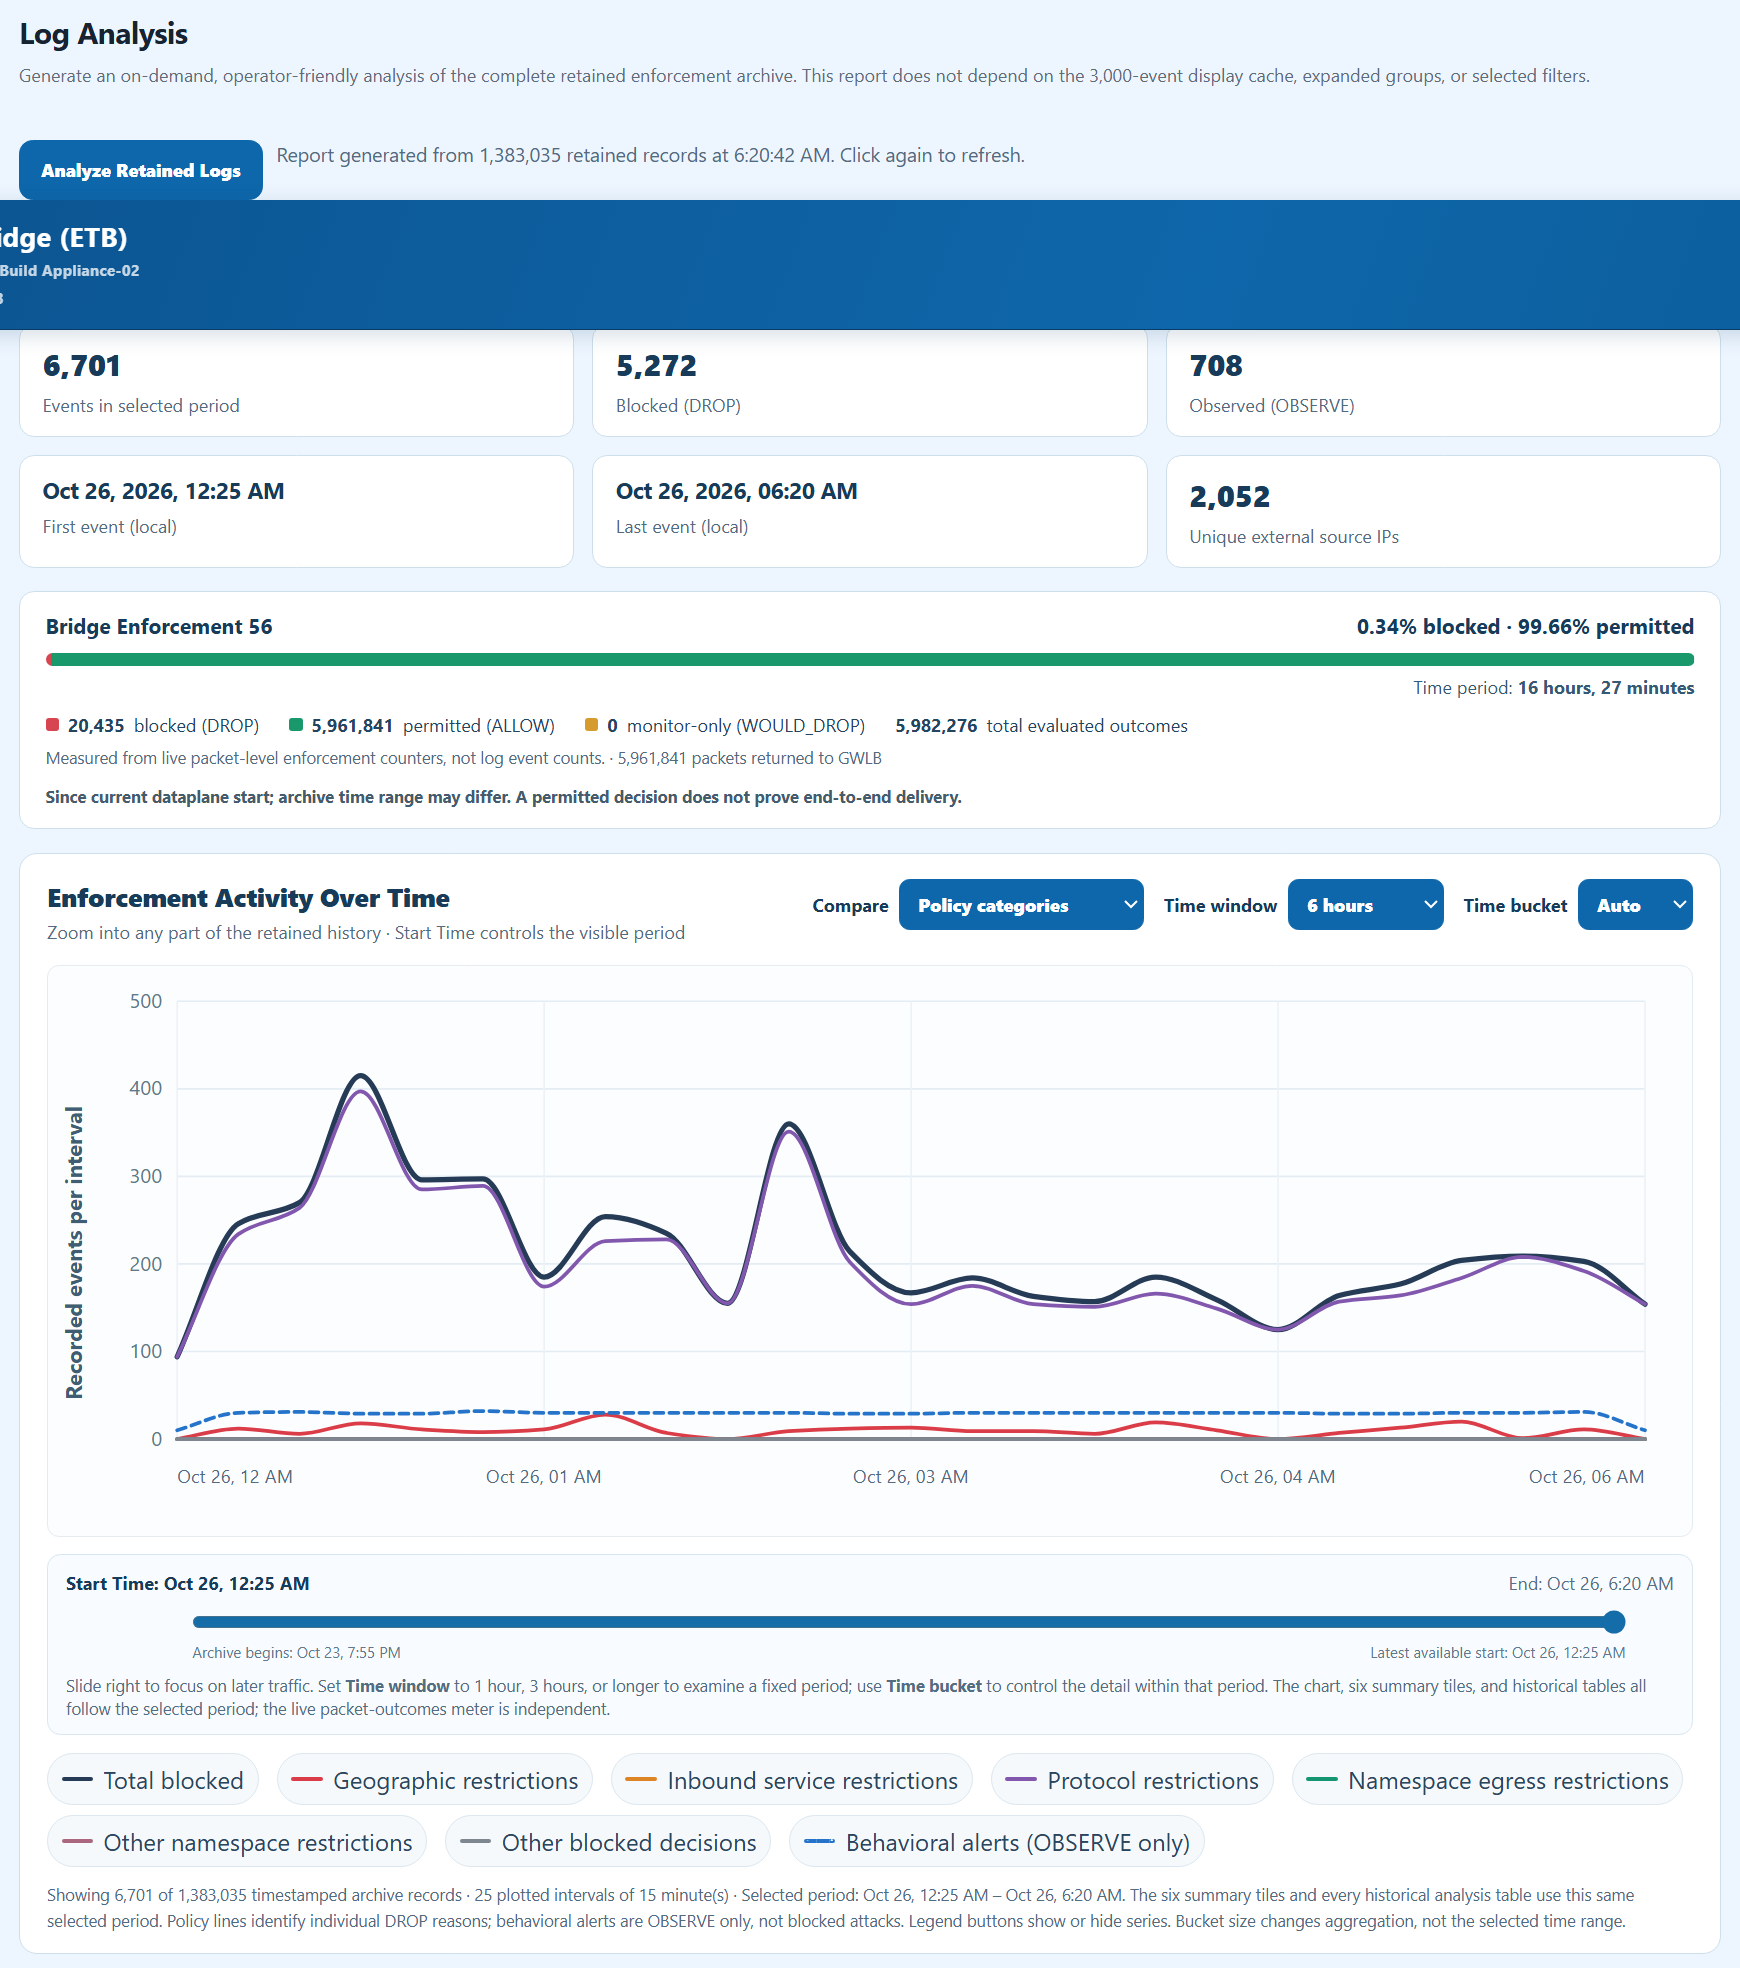
Log Analysis provides retained-history charts, category breakdowns and supporting evidence for operator review. Product counters and archive events have different accounting scopes and should not be conflated.
THE OPERATOR EXPERIENCE
The interface covers real administrative and operational capabilities.
Configure protected networks, approved peers, ingress services, egress destinations and protocol controls.
Inspect dataplane status, traffic health, decisions and behavioral metrics.
Manage approved updates, software activation and context-lifecycle controls through the appropriate interfaces.